Early-stage drug discovery requires deciding which compounds to make and test against a protein target.
Predicting structures accurately is only part of the problem. To be useful in early-stage drug discovery, models also need to pick out promising compounds from large candidate pools. Co-folding models address this with affinity or ranking heads: neural networks that use the model's learned representations and predicted complex to estimate binding strength or the probability of binding. Scientists then use these scores to prioritize compounds for experimental testing.
Those rankings need to make sense alongside the predicted structures. A compound ranked highly despite an implausible pose, or a score that barely responds when an essential binding interaction is removed, points to a model that has not learned to base its predictions on crucial compound-target interactions and can't be trusted to identify quality candidates in live drug design campaigns.
Recent studies show why this matters. On the ultra-large virtual screening hits benchmark, ULVSH, Bret, Sindt and Rognan found that Boltz-2 could distinguish experimental actives from inactives even after mutations disrupted important pocket interactions, and retained some discrimination when the target was replaced entirely. Bret et al., Journal of Chemical Information and Modeling
Boe et al. reported a related result in Learning probabilistic pharmacophore maps enables efficient hit finding. Across five LIT-PCBA targets, they replaced the real proteins with either a 100-residue polyalanine sequence or an artificial 81-residue three-helix bundle. Boltz-2's binding-probability predictions remained largely insensitive to these substitutions, with similar ligand rankings despite the unrelated targets. Their observations point to a substantial contribution from ligand identity in these tests. Boe et al., Digital Discovery
Björn Mattsson and Pat Walters highlight another reason to examine what affinity benchmarks measure. Related targets can have correlated affinity profiles, allowing training measurements for the same or similar ligands to carry information about a held-out target. Their strong ligand-only baselines on FEP+4 and OpenFE show how this can complicate claims about learning protein-ligand interactions. They do not establish how much of Boltz-2's performance comes from memorization. Björn Mattsson and Pat Walters, Identifying and Addressing Systematic Data Leakage in Protein-Ligand Affinity Benchmarks
To address these issues, we developed ApherisAffinity with a more structure-constrained affinity head, stronger filters on the training data, and targeted synthetic negatives that disrupt the interactions supporting binding. This approach makes the most out of the available affinity data, and produces more robust affinity predictions. While we demonstrate the benefits of this approach below based on public data, it is worth stressing that such strategies are expected to compound even more when training with high-quality affinity datasets as they can be found in the hands of large pharma companies, both for large-scale federated training runs and for local fine-tuning campaigns on individual drug design projects.
What the ULVSH benchmark reveals
ULVSH contains 943 experimentally tested compounds across 10 targets: 364 actives and 579 inactives. These compounds were selected from ultra-large docking screens, making the task more demanding than separating known binders from arbitrary decoys. Seven of the ten targets are GPCRs, so the benchmark covers a useful but limited part of target space. Bret et al., methods and supporting information
The adversarial tests change the protein while retaining the compounds and their original wild-type activity labels. Binding-site missense variants substitute one or two residues selected to disrupt established interactions. Examples include D110A in the dopamine D3 receptor, which removes an ionic anchor, and M156P in ROCK1, which disrupts a hinge hydrogen bond. Target shuffling instead pairs each compound set with a different protein; it does not shuffle residues within the original sequence. Bret et al., supporting information, Tables S3 and S6
Boltz-2's mean target ROC-AUC for binding probability was 0.742 on wild type, 0.709 after binding-site mutation and 0.603 after target shuffling. Its affinity readout showed the same pattern, with values of 0.717, 0.659 and 0.621. An ROC-AUC of 0.5 represents chance discrimination; 0.7 means that a randomly chosen active ranks above a randomly chosen inactive about 70% of the time, counting ties as half. That can help prioritize experiments, but usefulness also depends on how many actives appear near the top of the list and how many compounds can be tested. AUC alone does not establish that a model is ready for prospective screening. Interpreting ROC-AUC Retaining discrimination against the original labels after these interventions raises questions about how much the ranking depends on the specific target and binding geometry. Bret et al., supporting information, Table S4
Training on structurally supported examples
A measured binder paired with an incorrect predicted pose gives an affinity head a misleading training signal: it rewards a high score for contacts that may not explain binding. We therefore prioritize structural support, even when that means retaining fewer training examples.
Our data pipeline follows a similar approach to Boltz-2: curate measured affinity data and screening labels, generate protein-ligand structures, and train affinity and classification outputs. We standardize chemical structures and activity measurements, resolve conflicting replicates, and filter assays for suitability for training. Boltz-2 training approach
We then apply additional structural filters. Where a suitable complex exists in the RCSB Protein Data Bank (PDB), we select a reference using the protein sequence and similarity between the reference ligand and the training compounds. We first check whether the structure model can reproduce the experimental reference complex. We then align the proteins and compare each query ligand's predicted pose with this validated reference prediction. The comparison uses SuCOS, which measures overlap in molecular shape and chemical features. In order to qualify as a training example, the predicted binding pose must also have sufficient overlap with the reference.
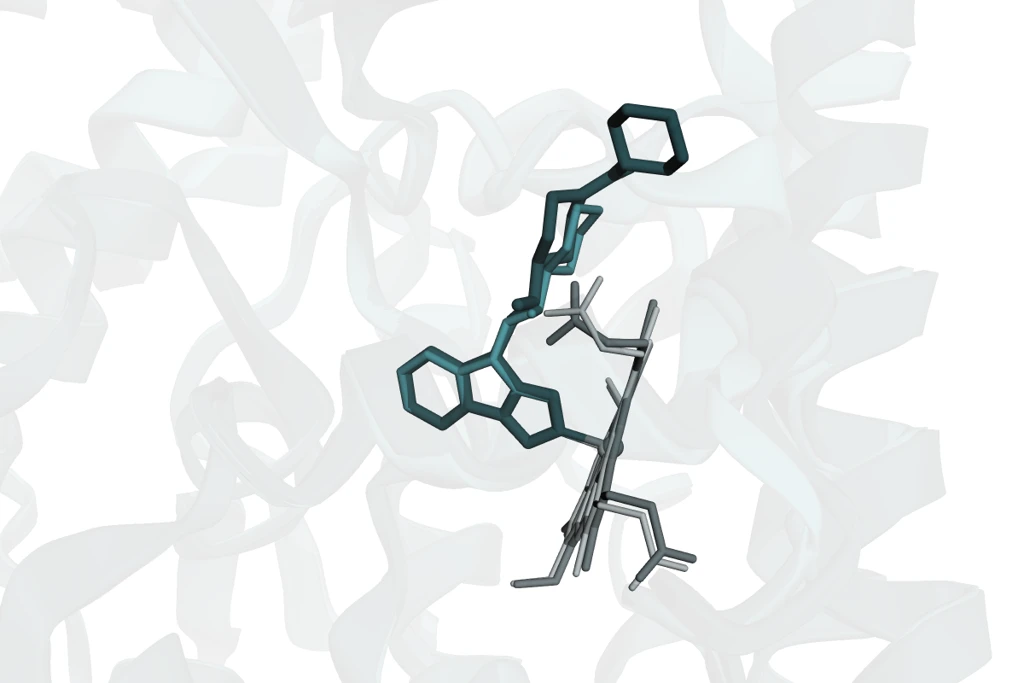
Pose agreement for human indoleamine 2,3-dioxygenase 1 (IDO1; UniProt P14902). Teal shows the re-predicted 5EK3 reference complex with ligand 5PK; dark teal shows the predicted complex with CHEMBL4461262, from assay CHEMBL4367262 (source assay ID 1866287; measured pEC50 6.48). Gray sticks show the heme cofactors retained in both complexes. The proteins are aligned, with no independent ligand alignment. The displayed query pose (seed 42, sample 0) has SuCOS 0.786 and ligand Tanimoto similarity 0.774 to the reference. The reference shown is a prediction whose agreement with experimental 5EK3 was checked separately (PLI-lDDT 0.946; BiSyR
When no suitable PDB reference is available, we assess consistency among predicted poses for related ligands within an assay. After protein alignment, those ligands should occupy overlapping binding regions with compatible chemical features. This provides a structural consistency check, although consistently predicted poses can still be wrong.
Both routes reduce the risk of pairing a valid experimental activity measurement with a predicted structure that does not support the corresponding binding mode. That matters because such mismatches can encourage a model to learn activity from ligand features while ignoring the supplied geometry.
An affinity head that reads local geometry
ApherisAffinity's Cartesian head combines frozen OpenFold3-OpenBind representations with an explicit graph of ligand atoms and nearby protein atoms, including side chains. Interactions in this graph depend on atom identity, interatomic distances and directions. This gives the head direct access to local packing and the orientation of contacts in the predicted complex.
The design draws on PBCNet2.0, a Cartesian tensor network developed by Yu and colleagues for relative binding-affinity prediction. PBCNet2.0 compares pairs of complexes using a Siamese architecture. We adapt its approach to geometric message passing into a head that scores individual co-folded complexes using OpenFold3 representations. The internal tensor features transform with rotations of the complex, while the final score stays unchanged. Yu et al., Nature Chemical Biology
Boltz-2's affinity module already uses structural information through a Pairformer operating on learned pair representations and predicted coordinates. Our Cartesian head makes geometry explicit at the level of pocket atoms and propagates directional information through successive interaction layers. The configuration evaluated here also removes the direct scalar-feature contribution from the final readout, making the prediction depend on features produced through the tensor interaction pathway. Chemical information still enters those interactions. These choices impose a stronger geometric constraint on the head, without guaranteeing physically correct predictions. Boltz-2 affinity architecture
Learning from disrupted binding sites
We also generate synthetic negatives that challenge the model to distinguish an active complex from a version with disrupted binding contacts. Starting from active protein-ligand pairs, we identify contacts that recur across ligands and predicted structure samples. We then sample one to three supporting residues and select substitutions intended to break those interactions. Replacing an acidic residue with lysine can reverse a salt bridge's charge; replacing a polar residue with alanine can remove a hydrogen-bond anchor. Other substitutions disrupt aromatic or hydrophobic packing.
We re-predict each complex using the mutated protein sequence and the original ligand, producing new structures and embeddings. These examples enter training as assumed inactives and supervise the binding classifier. The training mixture also includes synthetic negatives formed by changing ligand-target pairings.
Training scale and benchmark similarity
After filtering, the training corpus for the model evaluated here contains about 390,000 measured-affinity examples and 322,000 synthetic negatives. The measured-affinity portion is roughly a third of the 1.2 million curated ChEMBL and BindingDB regression examples reported for Boltz-2. Nesso-1 follows the same broad data-curation recipe as Boltz-2, with its own structural filtering. Our smaller corpus reflects a deliberate choice to require stronger structural support for the training signal. Boltz-2, Table 1; Nesso-1, data curation
We assessed the resulting chemical overlap by finding each evaluation ligand's nearest neighbor among the measured compounds in our training set. Mean nearest-training similarity is strictly lower for ApherisAffinity on every directly comparable public benchmark in Nesso-1's Figure 7: 0.380 versus approximately 0.478 on OpenBind, 0.443 versus 0.594 on CASP16, and 0.501 versus 0.784 on OpenFE. The published Boltz-2 and Nesso-1 points use the same similarity values. This establishes lower measured chemical similarity to ApherisAffinity's training data, but does not quantify how much of the performance difference is caused by leakage.
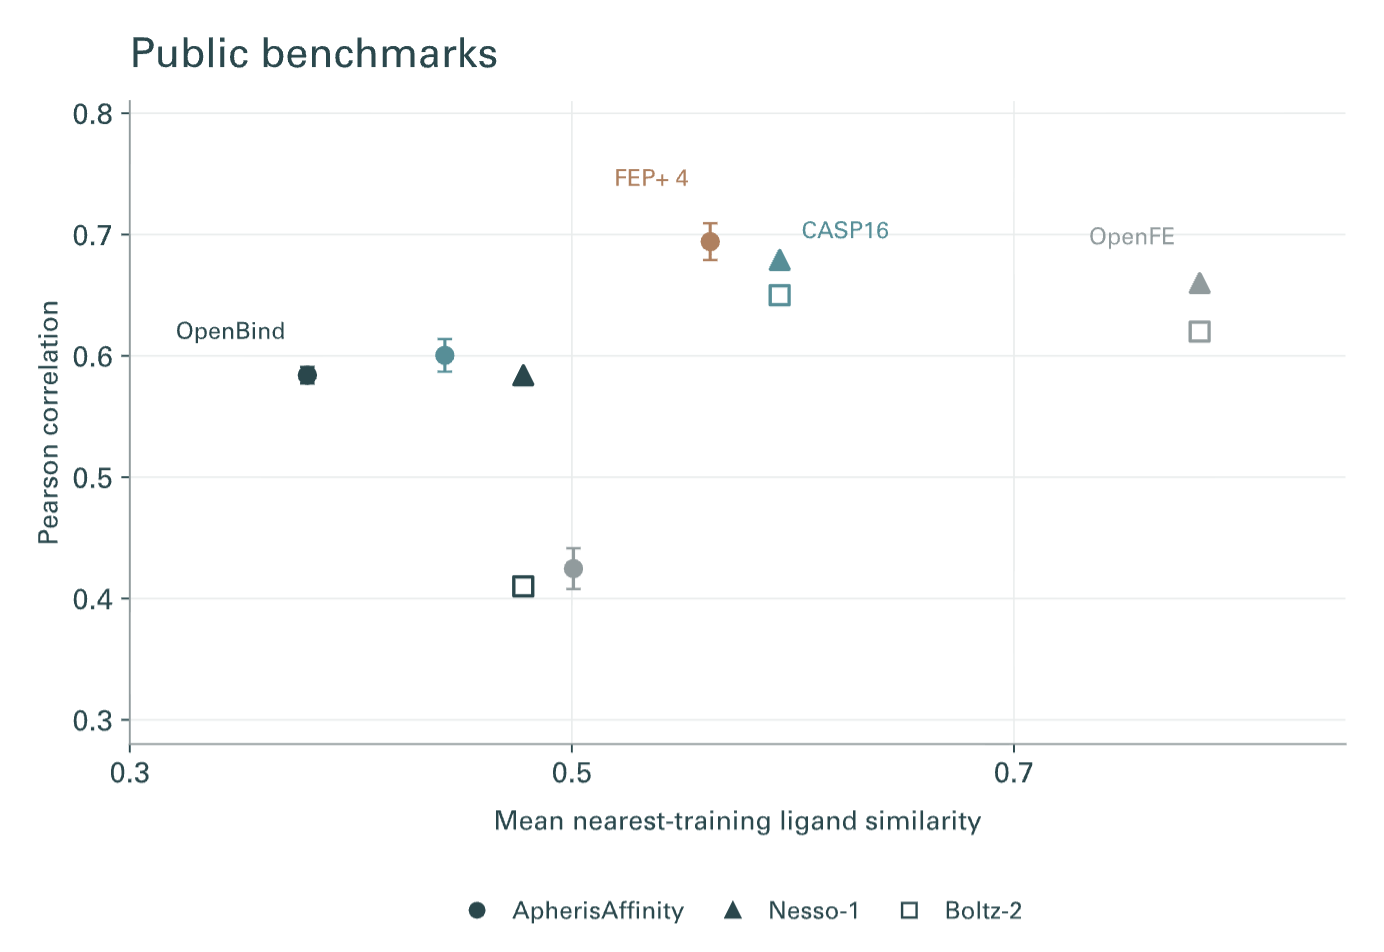
Public-benchmark training similarity and Pearson correlation. Within each benchmark, points farther left represent evaluation compounds less similar to the model's training chemistry; higher points indicate better affinity correlation. ApherisAffinity has lower training similarity on all three benchmarks with published comparator values. Colors identify benchmarks: dark teal for OpenBind, teal for CASP16, gray for OpenFE and brown for FEP+4. Circles denote ApherisAffinity, triangles Nesso-1 and open squares Boltz-2. ApherisAffinity points show means and standard deviations across ten inference seeds. Boltz-2 and Nesso-1 points are approximate values digitized from Nesso-1's Figure 7; no comparable FEP+4 point is reported there. Similarity is the mean maximum Morgan-fingerprint Tanimoto similarity to each model's affinity-training chemistry.
On ULVSH, our Cartesian model has lower wild-type discrimination than the published Boltz-2 baseline. Its binding-probability ROC-AUC is 0.626, compared with 0.742 for Boltz-2. After binding-site mutation, however, it falls to 0.505; after target shuffling, it is 0.508. Both are close to chance.

Mean ROC-AUC across the ten targets. Solid bars show affinity scores; hatched bars show binding probabilities. ApherisAffinity bars show the mean across ten OpenFold3 inference seeds, with whiskers indicating one standard deviation across seeds. Boltz-2 values are published point estimates. The dashed line marks chance discrimination against the original wild-type labels. The structure-prediction protocols differ between the two models. Boltz-2 reference values, Table S4
The choice of readout matters. ApherisAffinity's affinity score retains more discrimination after missense mutation, at 0.557, than its binding probability does. The near-chance result applies most clearly to the classification output, which receives the synthetic inactive supervision.
To examine that supervision, we trained the same Cartesian architecture without the synthetic mutated negatives, keeping permuted-pair negatives. Missense binding-probability ROC-AUC rose from 0.505 to 0.579, while wild-type AUC rose from 0.626 to 0.647. Synthetic mutation training helps address a documented failure mode of co-folding models: retaining wild-type activity rankings after key binding interactions have been disrupted. We consider the modest reduction in wild-type AUC in this ablation a worthwhile tradeoff for greater sensitivity to the target. A compound's predicted binding should depend on whether the protein can support the interactions that make it bind. That responsiveness is important for building scientists' trust when using model predictions to prioritize compounds for testing.
OpenBind performance
OpenFold3-OpenBind takes its name from the OpenBind consortium, which provided compute resources for training. The shared name does not mean that the model was trained on this OpenBind affinity benchmark, the model release describing training on public PDB structures only. Earlier EV-A71 fragment structures were already present in that public training data, however, so the target's structural context was not entirely unseen. OpenBind model release
We evaluated ApherisAffinity on the 494 compounds in OpenBind's EV-A71 2A protease affinity benchmark. The dataset comes from a fragment-screening and follow-on chemistry campaign, with experimental measurements made on the closely related CVA16 2A protease. It tests whether models can rank compounds within a real discovery series. OpenBind benchmark release
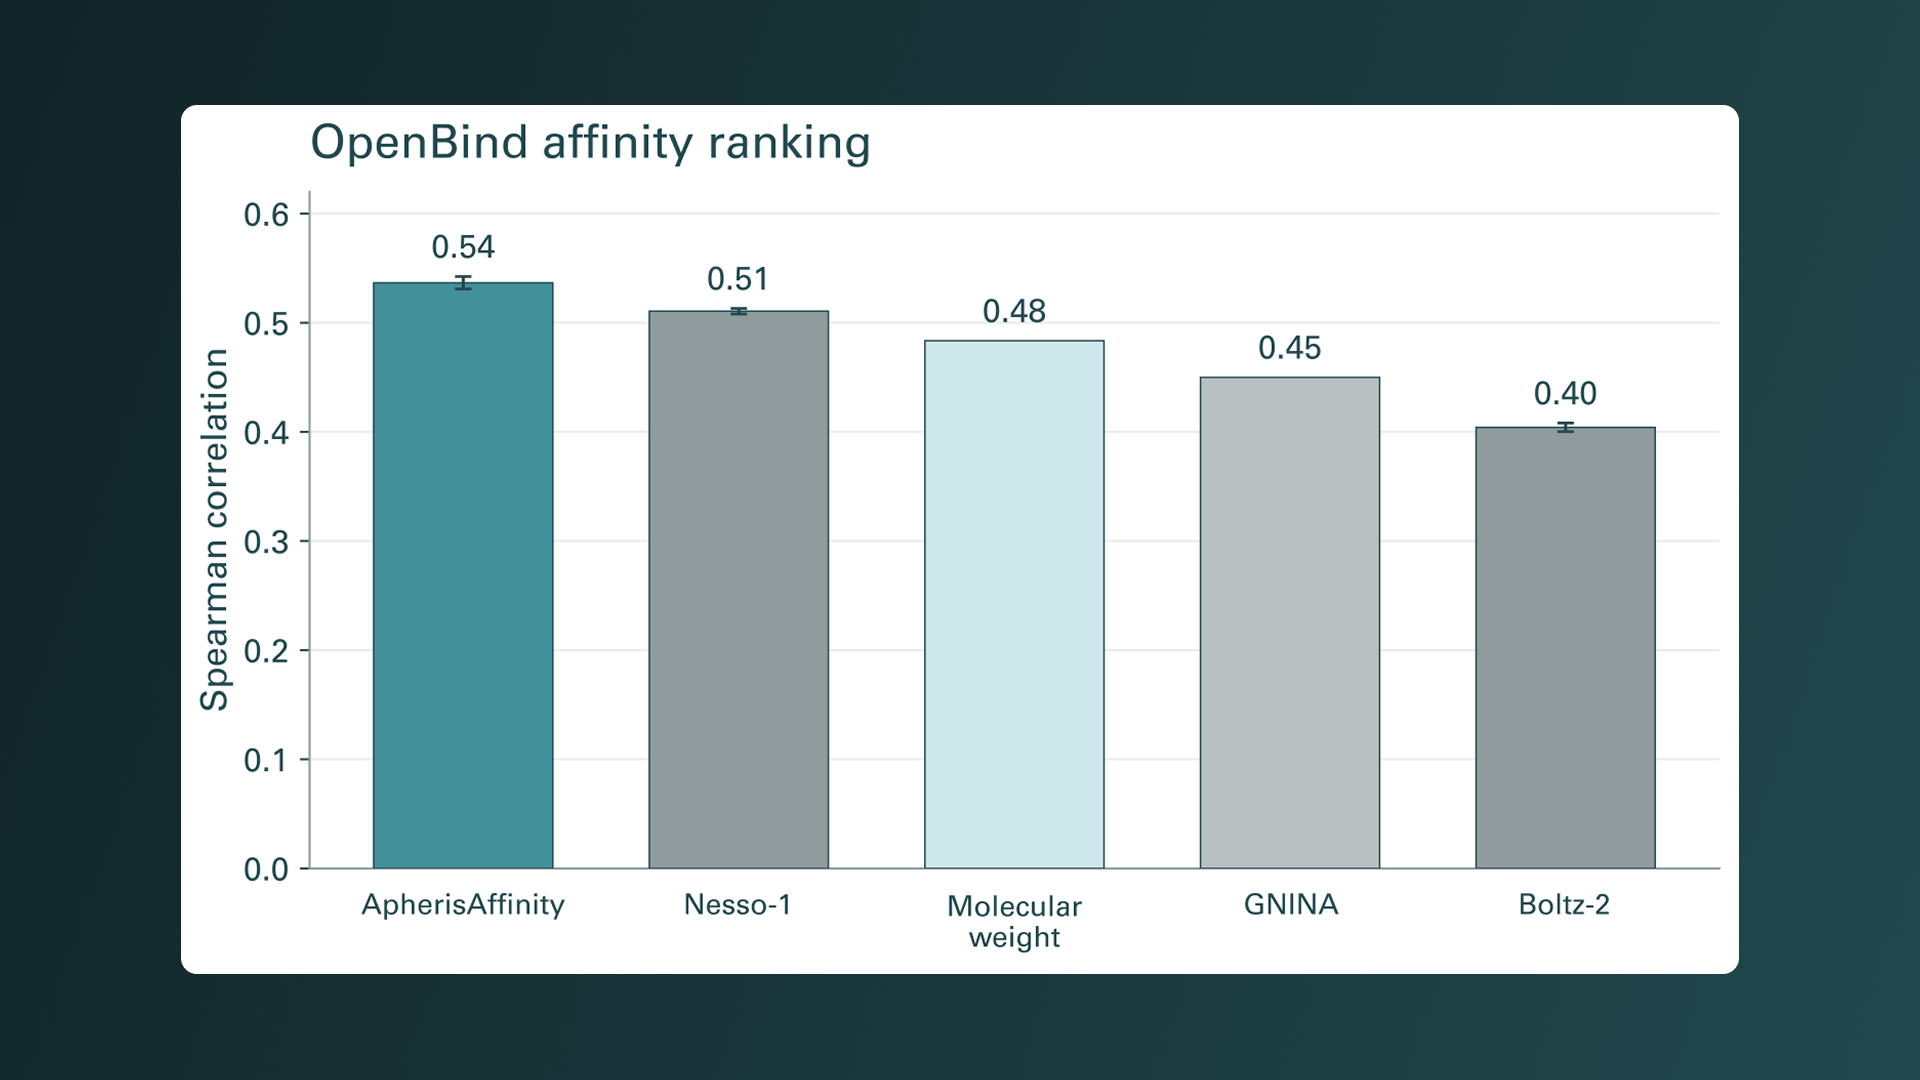
Our Cartesian head reaches a Spearman rank correlation of 0.537, compared with 0.512 for Nesso-1 and 0.404 for Boltz-2 over the same seeds. It has the highest numerical ranking correlation among the models compared here. Molecular weight alone reaches 0.483, making it a demanding baseline on this set.
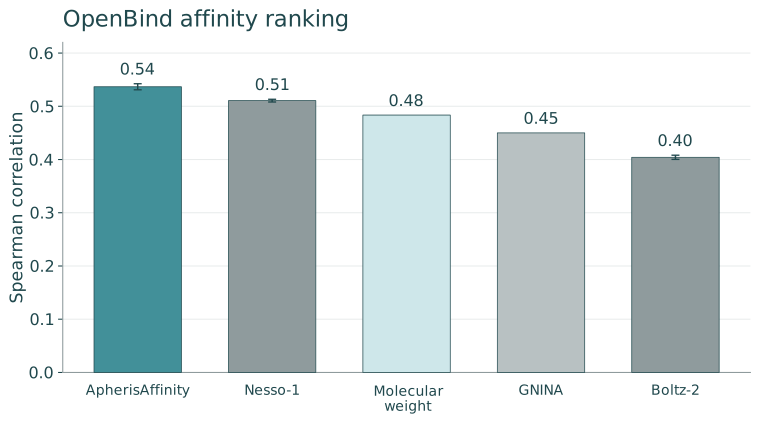
OpenBind results for 494 compounds. Higher Spearman correlation is better. All three models use ten inference seeds. Bars show the mean of the ten seed-level correlations, with standard-deviation whiskers. For ApherisAffinity, predicted pKd is first averaged across up to five available diffusion samples per compound and seed; Boltz-2 uses one diffusion sample per seed. GNINA uses the published point estimate. Published comparator results
Ranking compounds of similar molecular size
To test ranking beyond molecular size, we compared OpenBind compounds with the same heavy-atom count and molecular weights within 5 Da. We required measured pKd values to differ by more than one unit, corresponding to a greater-than-tenfold affinity difference. This gives 658 pairs spanning 336 compounds. For each pair, we assessed whether the model assigned higher affinity to the experimentally stronger binder.
ApherisAffinity correctly orders 66.1% of these pairs, compared with 53.6% for Nesso-1, 52.9% for Boltz-2, and 48.3% for molecular weight alone. Relative to molecular weight, ApherisAffinity improves correct ordering by 17.7 percentage points, with a paired 95% bootstrap interval of 6.1 to 29.1 points. This supports its ability to distinguish stronger binders among compounds of similar size.
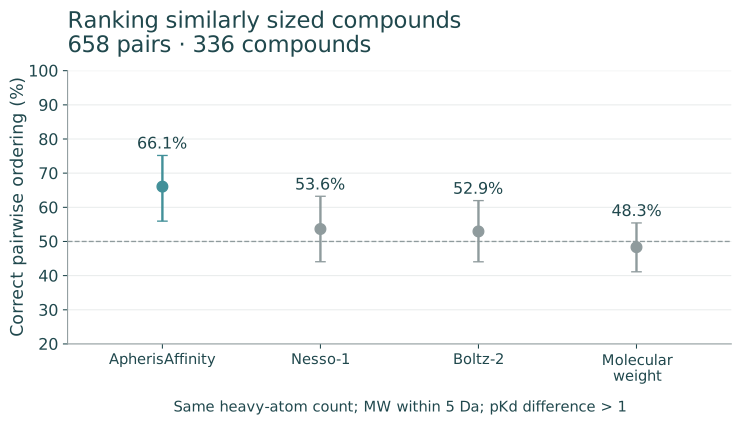
Correct ordering of 658 pairs matched for molecular size, with predicted ties receiving half credit. Each model shows the mean accuracy across ten inference seeds; ApherisAffinity uses the mean available pose score within each compound and seed. The molecular-weight baseline ranks the heavier compound higher. Whiskers show 95% intervals from 10,000 paired compound-bootstrap resamples. The dashed line marks 50% accuracy.
Ligand efficiency
We also assessed ligand efficiency, which expresses affinity per heavy atom. Correlations with measured LE are 0.463 for ApherisAffinity, 0.478 for Nesso-1 and 0.395 for Boltz-2, each averaged over ten inference seeds. Nesso-1 is marginally higher on this measure. Molecular weight divided by heavy-atom count gives a correlation of −0.115.
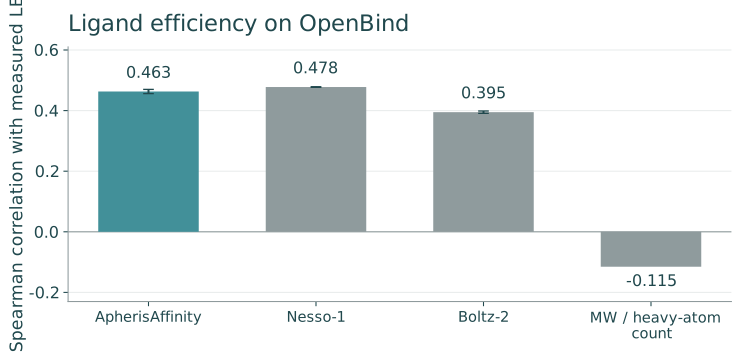
Spearman correlation with measured ligand efficiency for all 494 OpenBind compounds. LE = 1.4 × pKd / heavy-atom count, applied to both measured and predicted affinities. The descriptor baseline is molecular weight divided by heavy-atom count. ApherisAffinity, Nesso-1, and Boltz-2 show the mean and standard deviation across ten inference seeds.
Inference-time scaling
A structure-constrained affinity head should also be able to make better use of additional predicted poses. Within one co-folding pass, multiple diffusion samples share the same learned single and pair representations but produce different coordinates. A head that depends almost entirely on those shared representations will assign approximately the same affinity to every sample. Generating more poses then provides little new information to its ranking.
An affinity head that reads the predicted contacts can distinguish those samples. If it assigns higher affinity to more favorable interactions, additional samples give it more opportunities to identify a plausible binding arrangement. Taking the maximum predicted affinity across samples should then improve compound ranking. This is a testable expectation: selecting a maximum could otherwise amplify scoring errors.
We tested this on all 494 OpenBind compounds using five inference seeds and up to 50 diffusion samples per compound. For each seed, we increased the number of samples and compared two aggregation rules: the mean predicted affinity and the maximum predicted affinity. The heads remained fixed throughout the experiment.
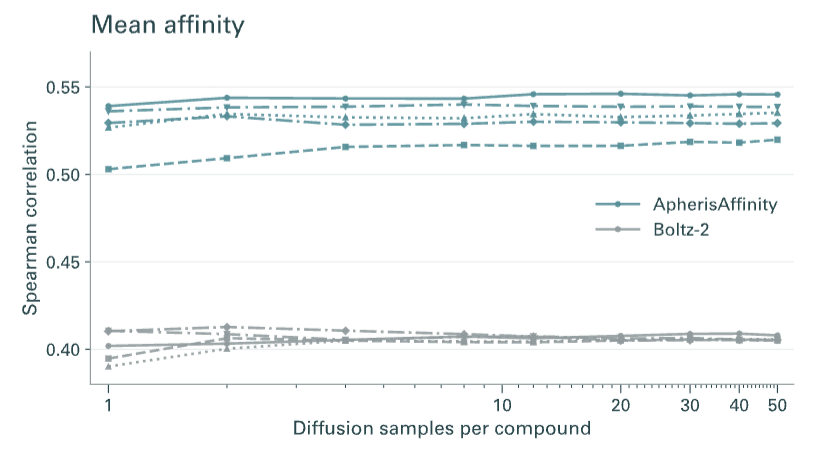
Mean affinity across diffusion samples. Each line represents one of five inference seeds; teal shows ApherisAffinity with OpenFold3-OpenBind, and gray shows native Boltz-2. The two scaling panels use identical axes, with diffusion sample count on a logarithmic scale.

Maximum affinity across diffusion samples, using the same compounds, seeds and nested sample sets. Higher pKd denotes stronger predicted binding. Line styles and markers distinguish inference seeds within each model.
With maximum-affinity aggregation, ApherisAffinity's mean Spearman correlation rises from 0.527 at one sample to 0.551 at 50 samples. All five seeds improve between these endpoints. Averaging affinities gives a smaller increase, to 0.534. Boltz-2 improves from 0.402 to 0.410 with maximum aggregation and to 0.406 with mean aggregation.
On this benchmark, ApherisAffinity therefore shows the desired inference-time scaling behavior: additional structures improve ranking, and selecting the highest-scoring sample is more useful than averaging. This is consistent with the head recognizing useful differences between predicted binding arrangements.
Available soon
ApherisAffinity combines structural filtering, an atom-level Cartesian head and interaction-guided synthetic negatives to make rankings more responsive to the predicted binding context. ULVSH shows greater sensitivity to target disruption alongside lower wild-type ROC-AUC. On OpenBind, its rankings distinguish compounds of similar molecular size and improve further when we select the maximum predicted affinity across additional structure samples.
Available from Oct 29.
References