Benchmarking🔗
The Apheris Hub provides benchmarking tools for evaluating model performance against ground-truth structures. This enables you to evaluate model accuracy, informing decisions on model selection and relevance for research tasks.
Overview🔗
Benchmarking is the process of evaluating a model on a set of reference biomolecular structures. The predictions made are then compared to the references, and metrics are generated, providing a quantitative result on model performance between areas, such as protein fold accuracy, ligand positioning, and physicality.
Within the cofolding model benchmarking, we categorize benchmarking into two types: global and local. Global benchmarking evaluates a diverse set of structures to assess general model performance across various targets, including multiple protein families and modalities. While global benchmarking provides an overview of model performance and aids in initial model selection, it typically does not specify which model to apply for a particular protein family or molecule class, nor highlights specific strengths and weaknesses for your use case.
Local benchmarking, in contrast, benchmarks a specific target or target class, using in-depth, tailored metrics. By enabling introspection of individual results, the end-user can decide if further fine-tuning or post-processing is necessary.
This is particularly useful for:
- Model Selection: Determine which model or weight version works best for your specific protein types
- Quality Assessment: Understand prediction confidence and identify areas where models may struggle
- Validation: Verify that model predictions are suitable for your downstream applications
- Comparison: Evaluate performance across different structures to understand model behavior
Benchmarking with ApherisFold🔗
ApherisFold features dedicated benchmarking capabilities via the frontend user interface and APIs, enabling users to easily run local benchmarks. You can assess cofolding models for targets and ligands relevant to your use case.
For example, you might assess all public structures of a protein or compare performance between mutation types to evaluate suitability for your program.
You can also evaluate performance on private structures. With local deployment, your benchmarking data remains private and confidential. Sensitive information never leaves the compute environment.
Getting Started with Benchmarking🔗
Prerequisites🔗
Before creating a benchmark, ensure you have:
- A deployed Apheris Hub with at least one model installed (OpenFold3, Boltz-2, or Mock)
- CIF (Crystallographic Information File) files containing both the structure to predict and the ground-truth reference structure
- Either a set-up MSA server connection, or pre-computed MSA files (
.a3mformat) for your sequences.
Accessing the Benchmark Feature🔗
Go to the Benchmark page in the Apheris Hub interface and locate it in the main navigation menu.
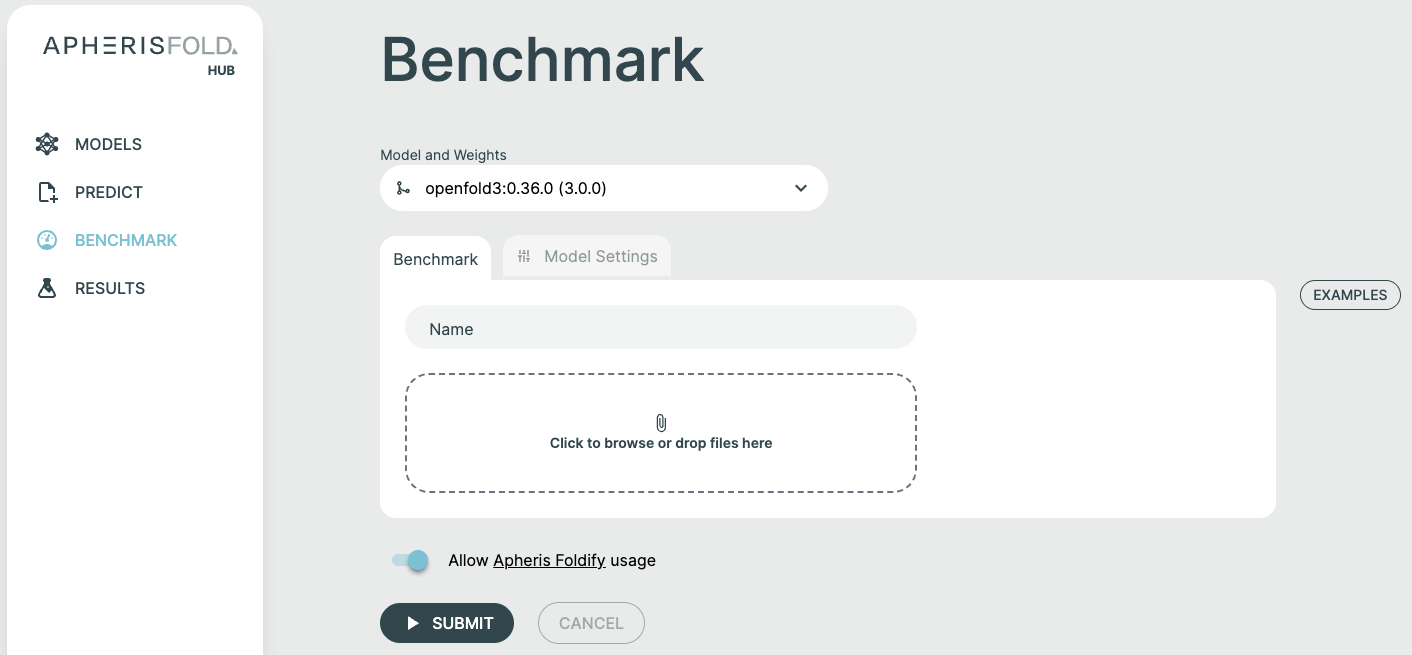
Creating a Benchmark🔗
Step 1: Select Model and Weights🔗
- Choose your target model from the Model and Weights dropdown
- Select the specific weight version you want to benchmark
- (Optional) Configure custom model parameters in the Model Settings tab
Step 2: Name Your Benchmark🔗
Provide a descriptive name for your run to easily identify and organize benchmarking results.
Step 3: Upload Input Files🔗
The Benchmark feature accepts two types of files:
CIF Files (Required)🔗
CIF files contain the protein structures to benchmark. Each CIF file should include:
- The molecular structure to be predicted
- The ground-truth reference structure for comparison
Upload multiple CIF files in one benchmark run. Each is processed as a separate structure, and aggregate metrics are calculated across all. Note that structures containing non-standard nucleotides are currently not supported.
To upload CIF files:
- Drag and drop
.ciffiles into the upload zone, or click to browse - The system will validate each file and extract protein sequences
- Files will be listed with their validation status
MSA Files (Optional)🔗
If you have pre-computed Multiple Sequence Alignment (MSA) files, you can upload them alongside your CIF files:
- MSA files should be in
.a3mformat - The MSA sequence must match a chain sequence in the corresponding CIF file
- The system will automatically match MSA files to the appropriate chains based on sequence similarity
Alternatively, your administrator can configure a global MSA server (ColabFold or NVIDIA NIM ColabFold) to generate MSAs automatically. See the Multiple Sequence Alignment section for details.
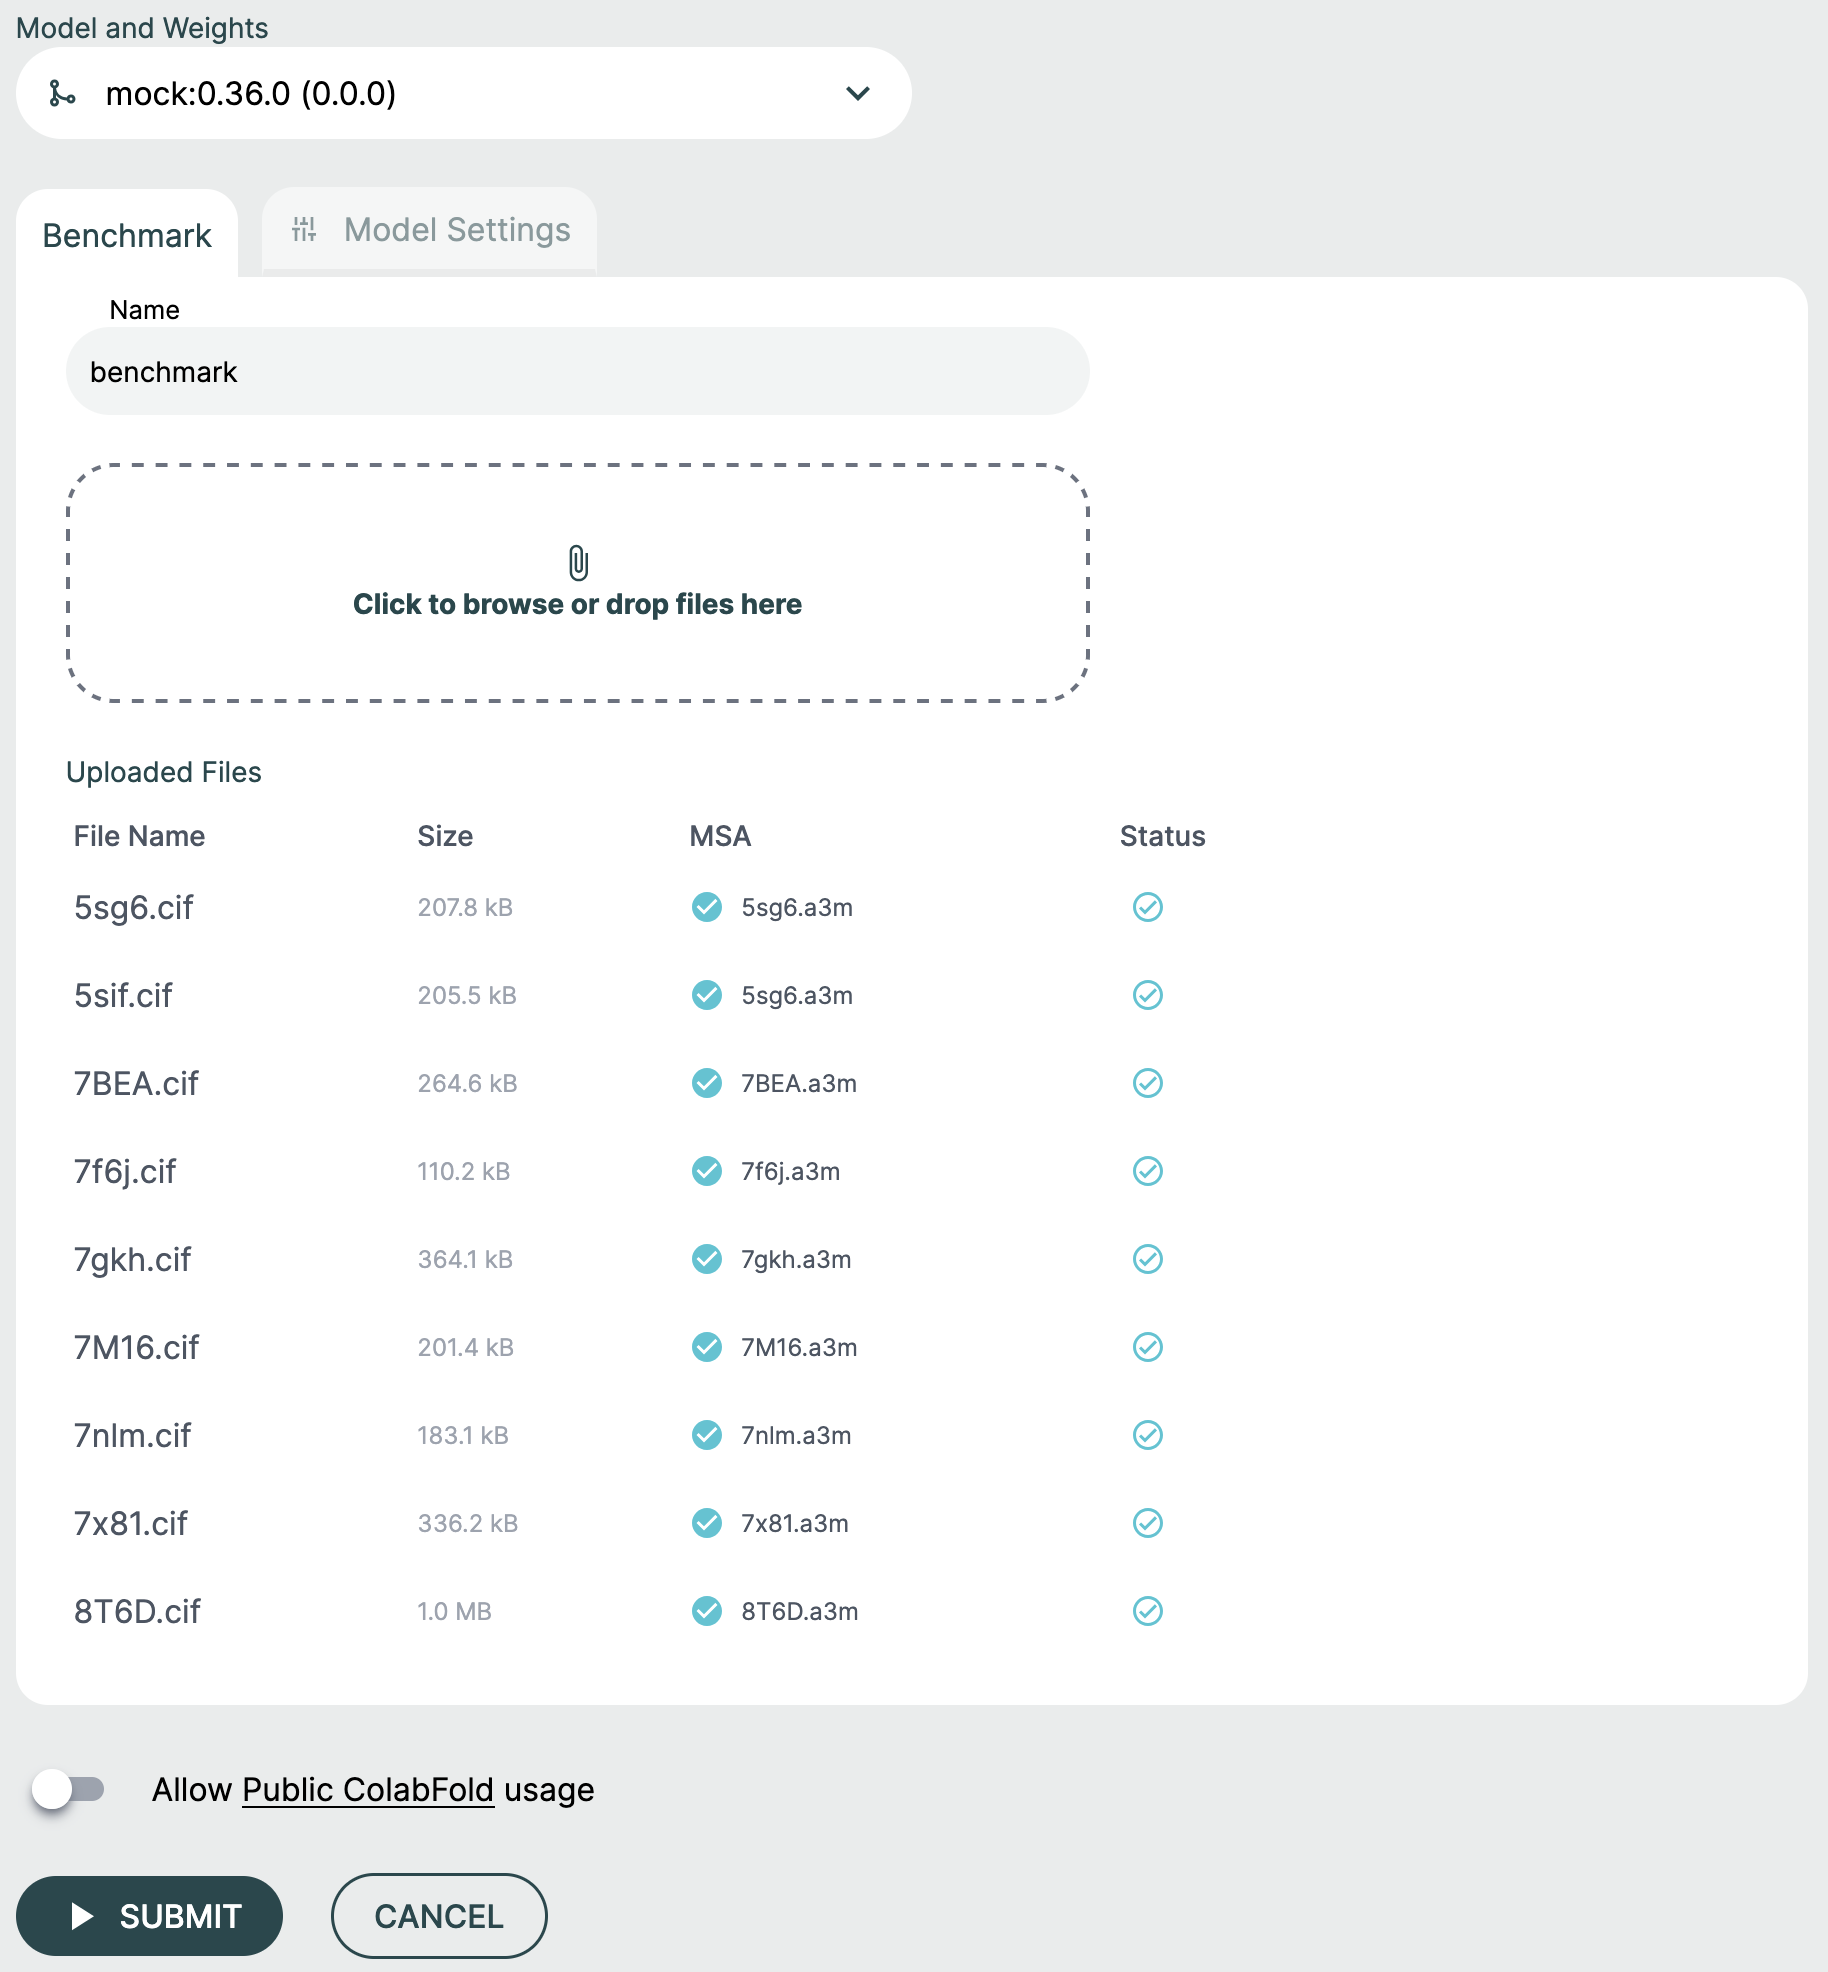
Step 4: Review and Submit🔗
Once your files are uploaded and validated:
- Review the list of structures to be benchmarked
- Verify that MSA files are correctly matched (if applicable)
- Click Submit to start the benchmarking run
Benchmarking Workflow🔗
File Upload and Validation🔗
When you upload CIF files, the Hub:
- Validates the file format and structure
- Extracts protein chain sequences from the CIF
- Identifies queries (protein chains) that need predictions
- Matches any provided MSA files to the appropriate chains
Each uploaded file is assigned a unique Query ID based on the filename (sanitized to alphanumeric characters, underscores, and hyphens).
MSA Processing🔗
If MSA files are provided:
- The system reads the MSA sequence from each
.a3mfile - MSA files are matched to protein chains based on sequence similarity
- Matched MSAs are stored and associated with their corresponding structures
If using an MSA server:
- The Hub will automatically request MSAs for sequences without pre-computed alignments
- MSA generation happens before the prediction jobs start
- If MSA preparation fails before a benchmark request exists, the affected structure stays visible in the benchmark details with status MSA preparation failed and the reported chain-specific error. That row does not link to a prediction result page because no request was created for it.
Prediction Execution🔗
Once all files are validated and MSAs are ready:
- Click Start Benchmark (or the benchmark automatically starts after file processing)
- The Hub creates input datasets for each structure
- Prediction jobs are submitted to the selected model
- Each structure is processed independently
You can monitor progress on the Results page as jobs complete.
Metrics Calculation🔗
After each prediction completes, the system:
- Compares the predicted structure to the ground-truth reference
- Persists the benchmark-specific metrics (see Metrics below) on the completed prediction request
- Reads benchmark metrics and request-backed failure state from that persisted request execution data
- Aggregates metrics across all request-backed structures in the benchmark
- Displays results in the benchmark details view
Viewing Results🔗
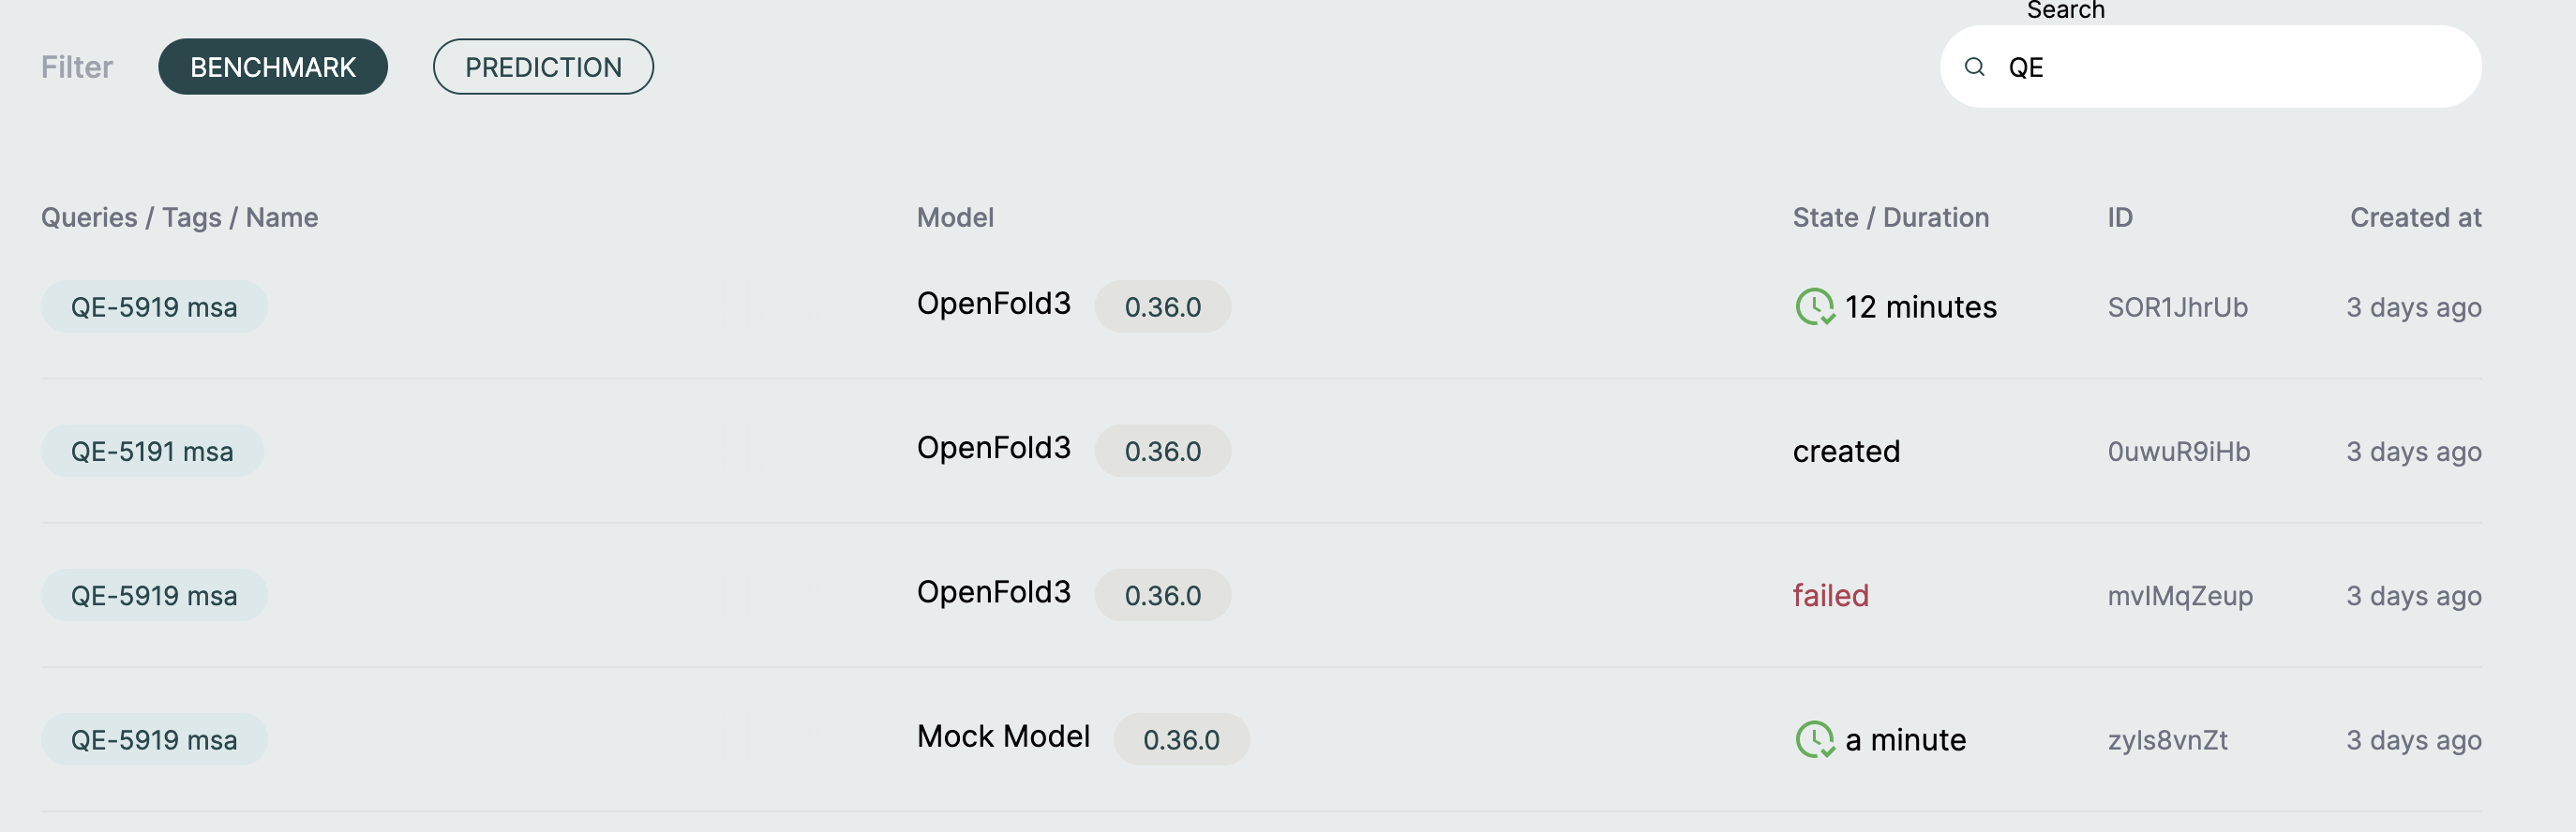
Results Page🔗
Navigate to Results and select your benchmark to view detailed outcomes.
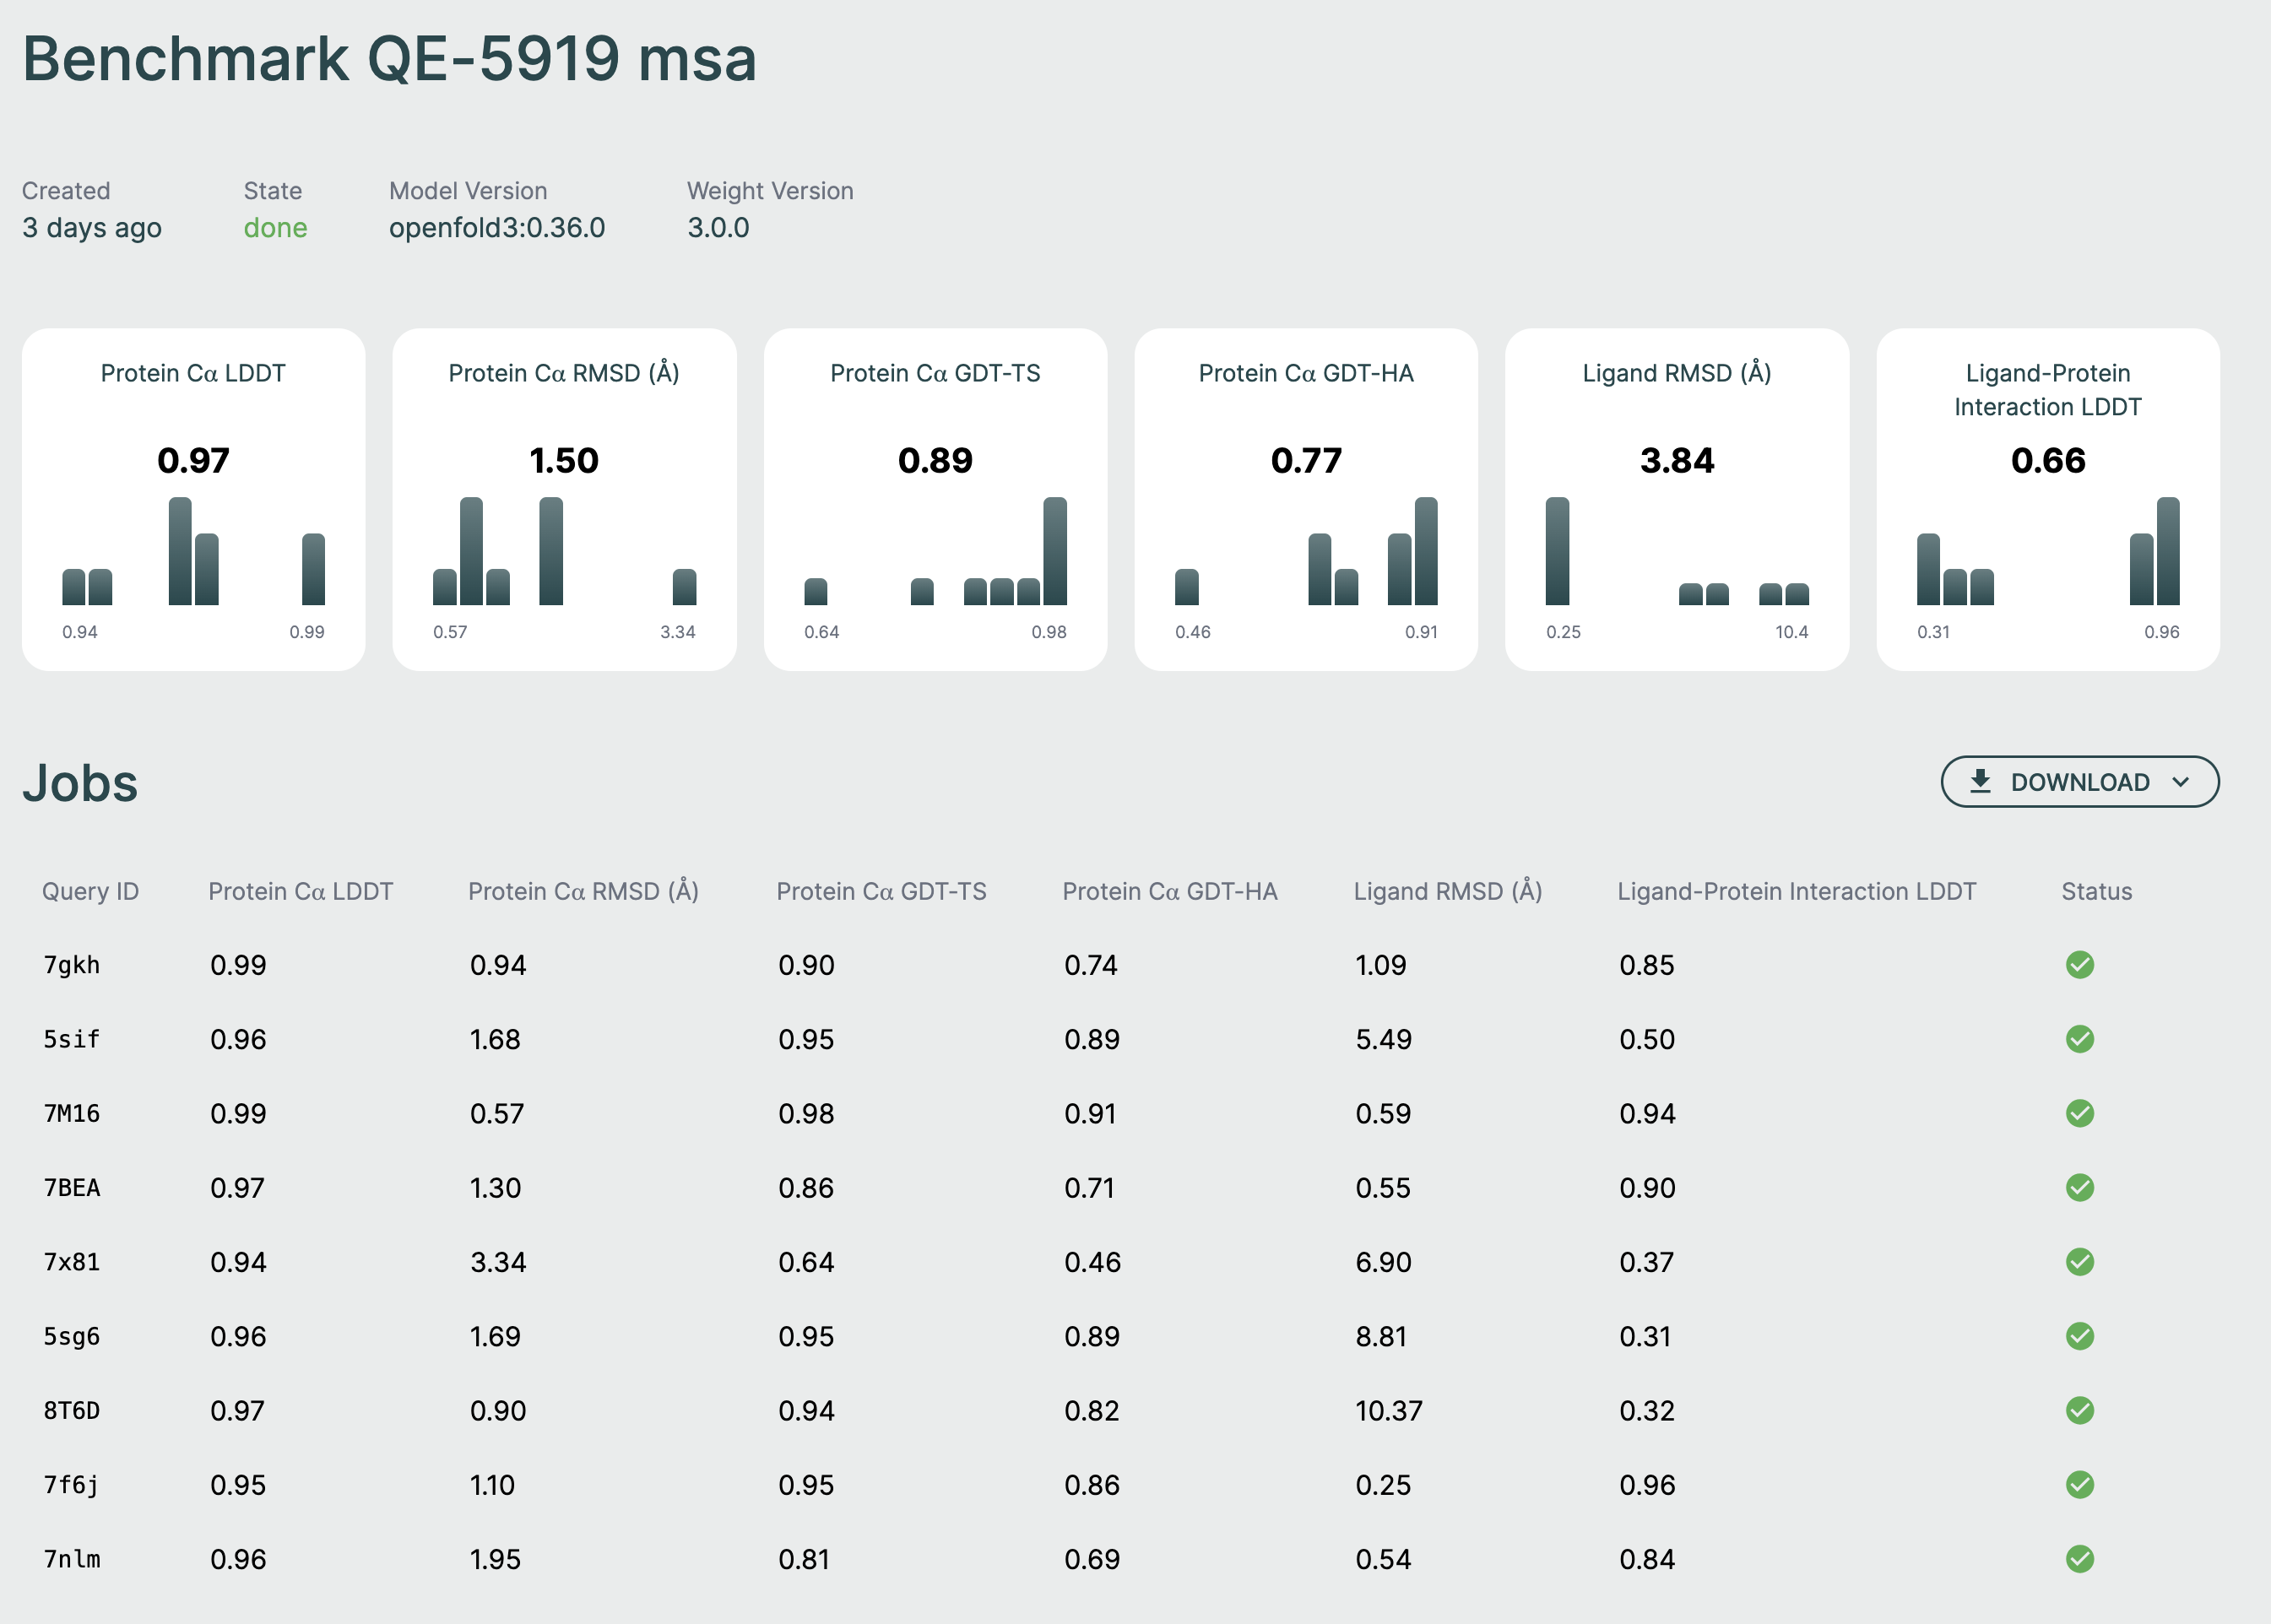
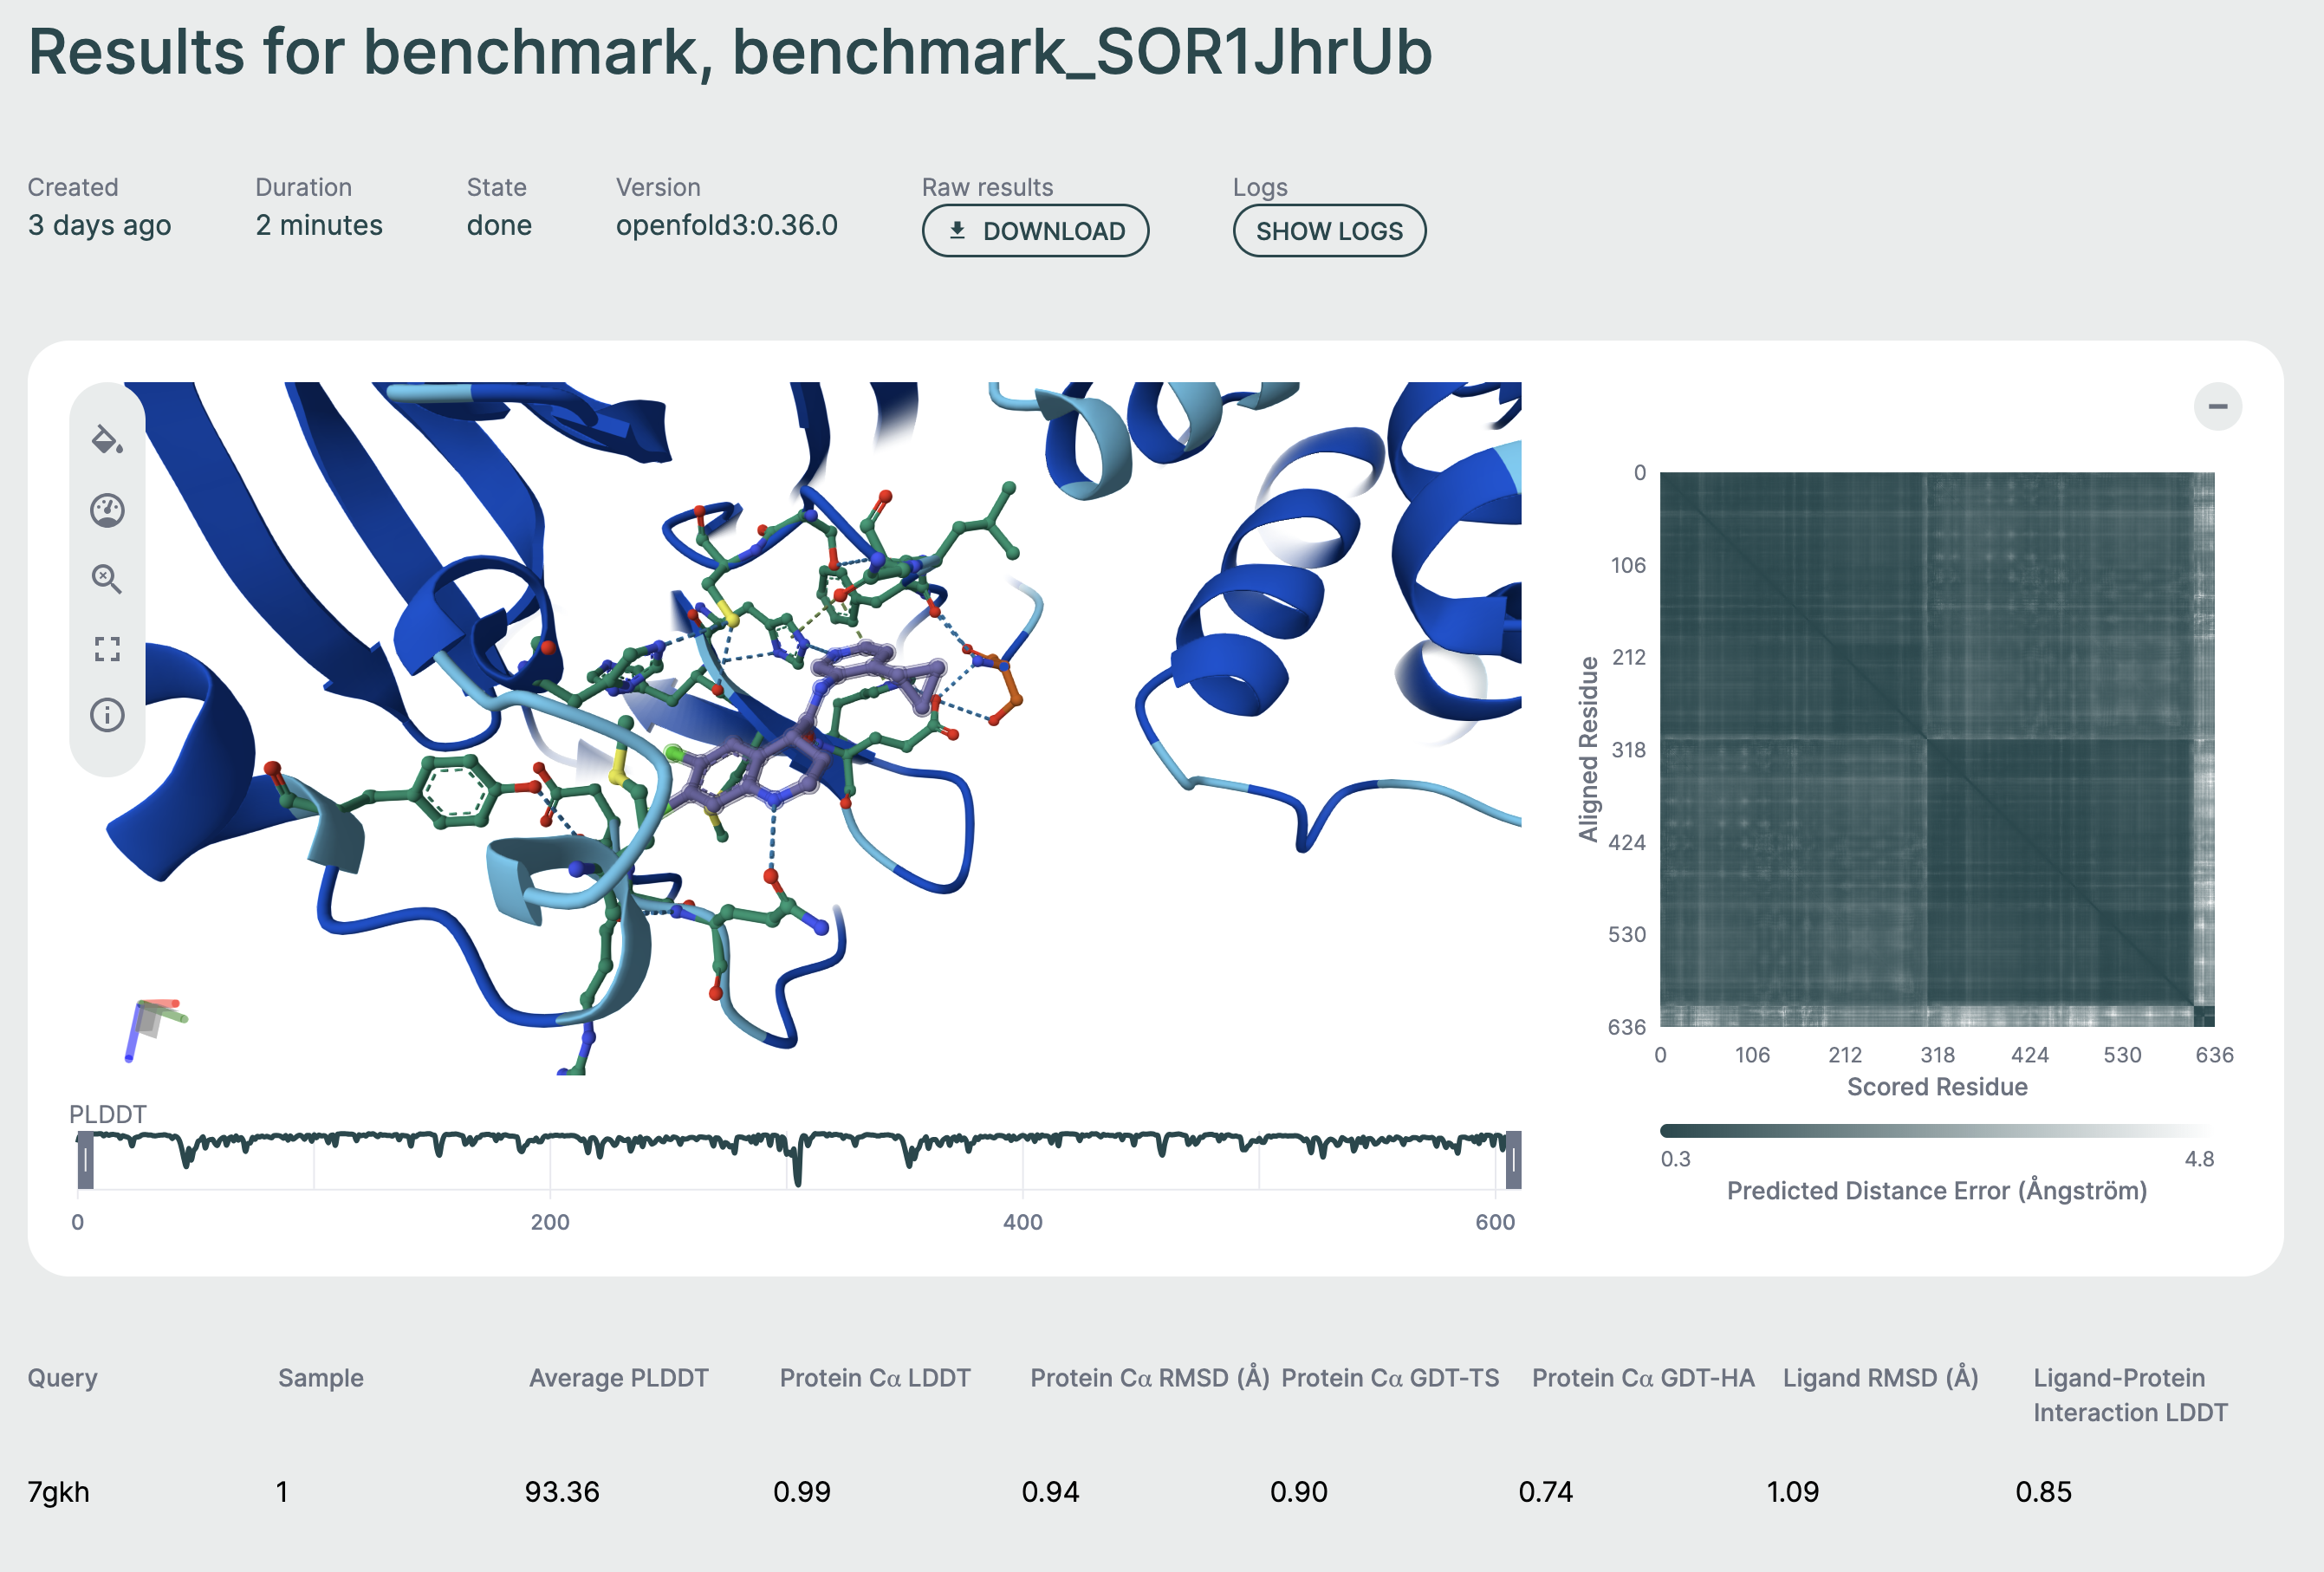
The benchmark results page displays:
Summary Metrics🔗
At the top of the page, you'll see aggregate metrics calculated across all relevant structures in your benchmark:
- Protein Cα LDDT: Local Distance Difference Test for alpha-carbon atoms
- Protein Cα RMSD: Root Mean Square Deviation for alpha-carbon atoms
- Protein Cα GDT-TS: Global Distance Test - Total Score
- Protein Cα GDT-HA: Global Distance Test - High Accuracy
- Ligand RMSD: Root Mean Square Deviation for ligand atoms
- Ligand-Protein Interaction LDDT: LDDT for protein-ligand binding sites
Each metric card shows:
- The average value across all completed jobs
- A histogram showing the distribution of values
Jobs Table🔗
Below the metrics, a table lists all individual structures in the benchmark:
| Query ID | Metrics | Status |
|---|---|---|
| Structure identifier | Individual metric values | Job state |
Query ID: The identifier assigned to each structure (based on filename) Metrics: Individual metric values for that specific structure Status: Displayed state of the prediction job. Queued, accepted, and not-yet-active jobs display as pending. Active jobs display as running. Finished jobs display as done, failed, or cancelled.
For serialized benchmark runs, the table shows only one running row at a time while later jobs remain pending until they become active. Benchmarks that support parallel execution can show multiple running rows at the same time.
If a structure fails during MSA preparation before a prediction request is created, the table still shows that structure as failed with status MSA preparation failed and the detailed chain-specific error message. Those rows do not open an individual result page because there is no prediction request behind them.
Click on any row to view detailed results for that specific structure, including:
- Full 3D structure visualization
- Per-residue metrics
- Confidence scores
- Downloadable output files
Individual results🔗
By clicking on a row of the table, you will be able to view the result for that specific prediction. This page features a 3D viewer that enables you to inspect the binding pose and interactions, as well as general metrics and properties for the specific prediction.
Metrics🔗
The following set of metrics is currently returned (where relevant):
Protein Metrics🔗
Protein C⍺ LDDT🔗
Range:
[0–1], higher is better.
This metric assesses how close the relative distances of C⍺ atoms (the backbone carbon atom between the amine and the carbonyl) to eachother are compared the reference. This assessment evaluates the preservation of the local structure (sheets, helices, pockets) in the prediction compared to the reference. LDDT = Local Distance Difference Test.
Protein C⍺ RMSD🔗
Range:
[0Å–40Å+], lower is better.
This metric assesses the absolute distance of the coordinates of C⍺ atoms (the Root Mean Square of the position Difference) between the predicted structure and the reference, after an alignment step. This is an assessment of global positioning and structure.
Protein C⍺ GDT-TS🔗
Range:
[0–1], higher is better.
This metric assesses the absolute distance of the coordinates of C⍺ atoms, similar to the RMSD, but assigns a score of 0 to 1 depending on specific distance thresholds (1Å, 2Å, 4Å, 8Å). Functions like RMSD, but normalized. GDT-TS = Global Distance Test – Total Structure
Protein C⍺ GDT-HA🔗
Range:
[0–1], higher is better.
Functions the same as GDT-TS, but with tighter distance thresholds (0.5Å, 1Å, 2Å, 4Å). Useful for comparing results with high confidence. GDT-HA = Global Distance Test – High Accuracy
Ligand Metrics🔗
Ligand RMSD🔗
Range:
[0Å–10Å+], lower is better.
This metric measures the absolute distance between the coordinates of all ligand atoms and their corresponding positions in the reference structure, after aligning the protein structures to each other. This assessment evaluates the accuracy of ligand pose prediction.
Protein-Ligand Interaction LDDT🔗
Range:
[0–1], higher is better.
Similar to the protein C⍺ LDDT, this metric assesses local distance deviations between protein C⍺ atoms and each ligand atom. This evaluates the placement of the ligand in conjunction with the shape of the pocket, serving as a general metric for assessing the correctness of the protein–ligand interface.
Understanding Metrics🔗
Average Metrics: Displayed at the top of the benchmark results page, calculated as the mean across all structures.
Per-Structure Metrics: Available in the jobs table, showing individual performance for each structure.
Histograms: Visual distributions help identify outliers and understand metric spread across your test set.
Best Practices🔗
File Preparation🔗
- Naming: Use descriptive, consistent filenames for your CIF files
- Quality: Ensure CIF files contain valid, complete structures
- Organization: Group related structures in a single benchmark for easier comparison
MSA Strategy🔗
- Pre-computed MSAs: Recommended for reproducibility and speed
- MSA Servers: Useful for exploratory work or when MSAs are not available
- Sequence Coverage: Higher MSA depth generally improves prediction quality
Benchmark Design🔗
- Test Set Size: Include enough structures for statistical significance (typically 10+)
- Diversity: Choose structures that represent your domain of interest
- Controls: Include known-good and challenging cases to calibrate results
Troubleshooting🔗
File Upload Issues🔗
Problem: CIF file validation fails
Solutions:
- Verify the CIF file is valid and complete
- Check that the file contains both structure and reference data
- Ensure file permissions allow reading
Problem: MSA file not matching to structure
Solutions:
- Verify the MSA sequence matches a chain in the CIF file
- Check that the
.a3mfile is properly formatted - Review sequence extraction from the CIF file
Job Failures🔗
Problem: Benchmark jobs fail or remain stuck
Solutions:
- Check the Hub logs for error messages
- Verify the model service is running and accessible
- Ensure adequate GPU resources are available
- Review input file quality
Metrics Display🔗
Problem: Metrics show as undefined or missing
Solutions:
- Wait for all jobs to complete
- Check that ground-truth structures are present in CIF files
- Verify job completed successfully without errors
- Review the job output for metrics calculation errors
File Metadata🔗
The Hub tracks:
- Original filenames
- Upload timestamps
- Query IDs assigned to each structure
- MSA associations
This metadata is displayed with the results to help you identify which structure produced which results.
For additional support or questions about benchmarking, contact support@apheris.com.