Monitoring Gateways🔗
Basic overview in the Governance Portal🔗
The Governance Portal allows you to see the most important settings of your Gateway(s) as well as its running status.
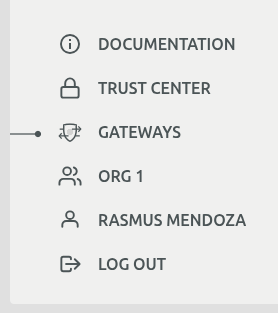
Accessing Gateways🔗
Gateways have a dedicated navigation item in the Governance Portal sidebar, making them easily accessible from anywhere in the application.
Access Permissions🔗
Access to the gateway monitoring views is role-based and depends on your user role and organization configuration:
| Role | Access Level | Description |
|---|---|---|
| Owner + Admin Organization configured | Full Access | Users who have the Owner role in an organization that is configured as an admin organization can view all gateways associated with the orchestrator across all organizations. An admin organization is one whose ID is listed in the orchestrator config setting adminOrgIds. Please contact your Apheris to configure this for your environment. |
| Owner, Data Steward | Organization Scope | Can only view gateways associated with their own organization. Gateways from other organizations are not visible. |
| Other roles | No Access | Cannot access the gateway monitoring views. |
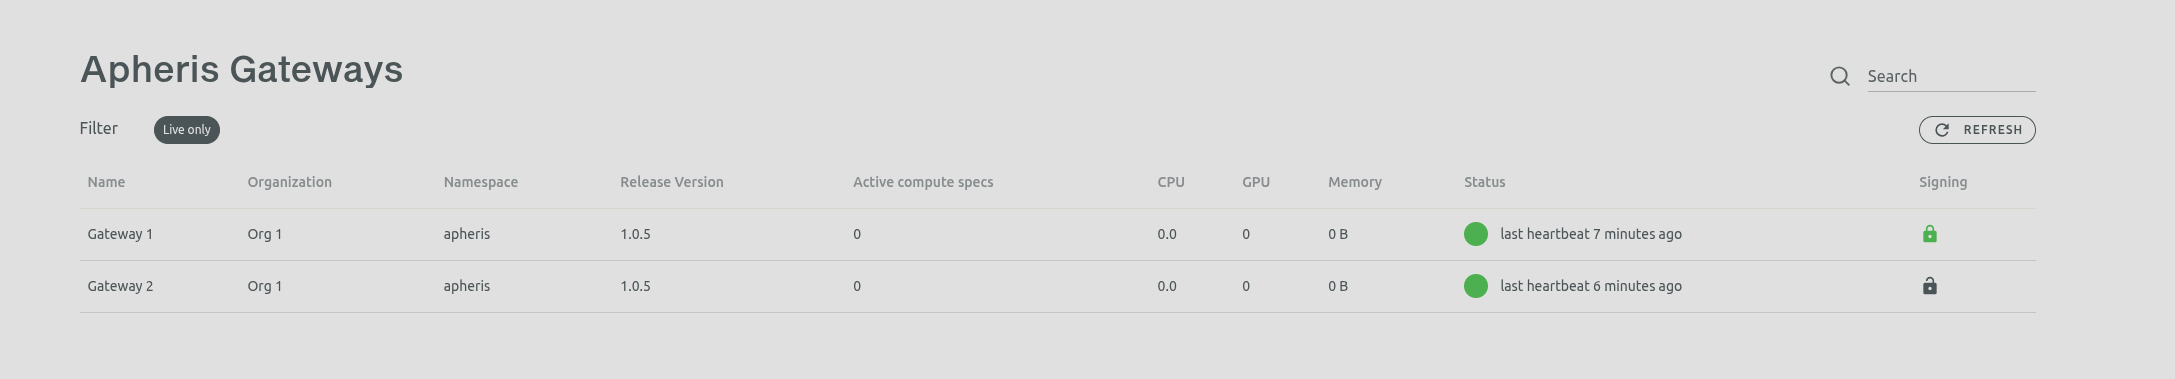
Gateway List View🔗
The gateway list provides a comprehensive overview of all your gateways with the following columns:
| Column | Description |
|---|---|
| Name | The gateway identifier |
| Organization | The organization the gateway belongs to |
| Namespace | The Kubernetes namespace where the gateway is deployed |
| Release Version | The current software version of the gateway |
| Active compute specs | Number of active computation specifications |
| CPU | CPU resource allocation |
| GPU | GPU resource allocation |
| Memory | Memory resource allocation |
| Status | Current operational status |
| Signing | Digital signature verification status |
Use the search box to filter gateways by name, toggle "Live only" to show only active gateways, or click the refresh button to update the list. Click any row to view detailed gateway information.
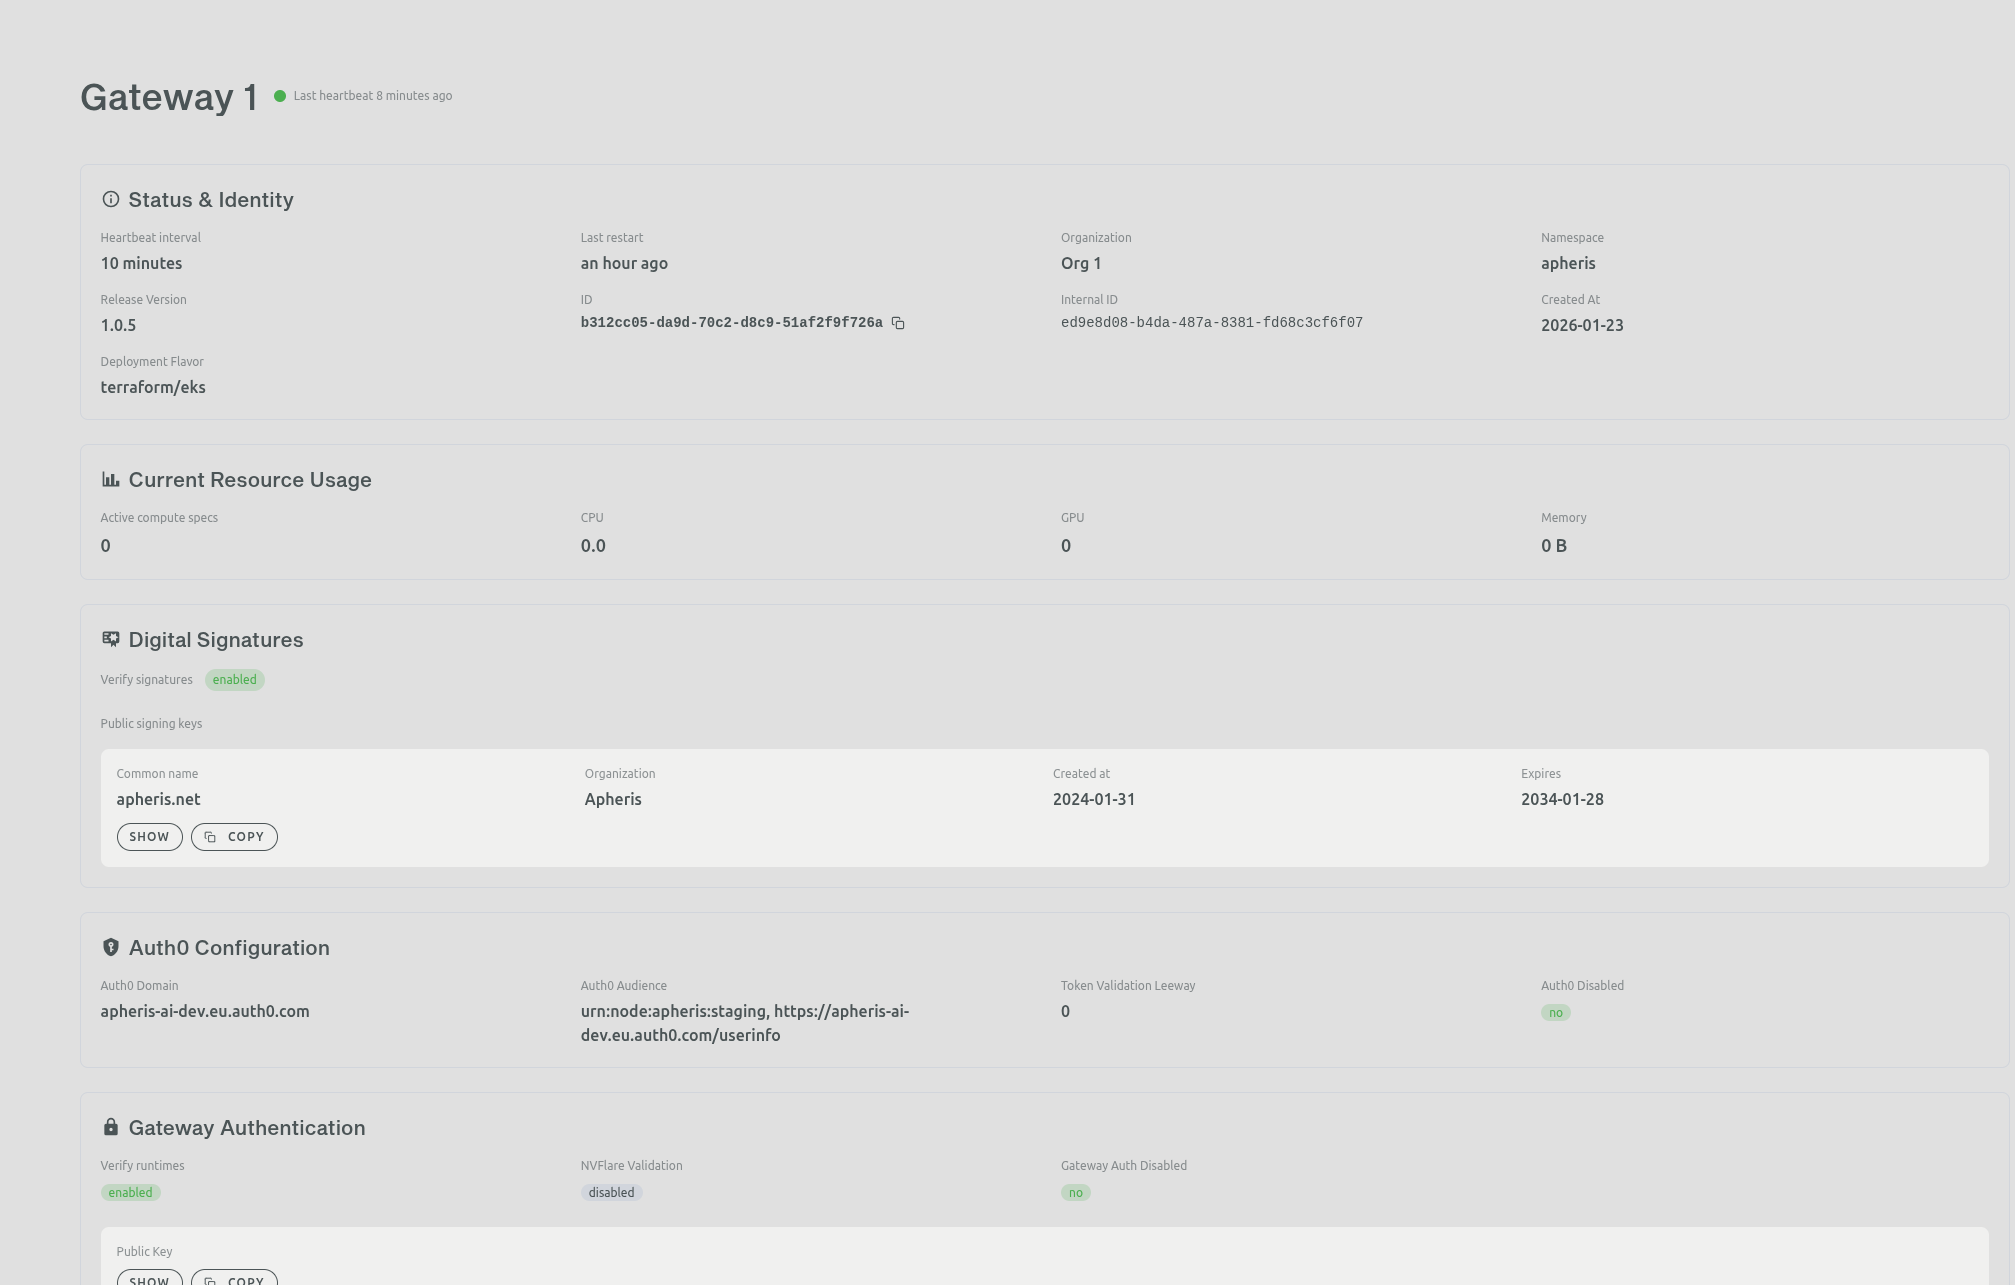
Gateway Details View🔗
Clicking on a gateway opens the details view, which provides comprehensive configuration and status information organized into the following sections:
- Status & Identity - Heartbeat interval, last restart time, organization, namespace, release version, gateway and agent IDs, and deployment flavor
- Current Resource Usage - Active compute specs, CPU, GPU, and memory utilization
- Digital Signatures - Verification status and public signing keys with certificate information
- Auth0 Configuration - Domain, audience, and token validation settings
- Gateway Authentication - Runtime verification, NVFlare validation, and public keys
Gateway logs🔗
Note
All Apheris components logs are on UTC timezone.
Log Event Ingestion🔗
The Apheris Gateway components emit logs in jsonline format to stdout/stderr.
This integrates with any logging system that is tailored towards Kubernetes.
Note
No Apheris component maintains log files.
Log shipping, ingestion and indexing is out of scope of this guide as we cannot reasonably provide meaningful documentation for setting this up. Please find information about setting up log shipping, ingestion and indexing in the documentation for your specific logging system.
If you have further questions, please contact your Apheris representative or reach out via support@apheris.com.
Log Event Format🔗
All Gateway components produce logs in jsonline format (one json document per log event on a single line) and emit them to the containers (and pods) stdout.
The logs are leveled, the default level is info. The log levels can be set via the agent.logLevel and dal.logLevel helm values.
Fields🔗
| field | description |
|---|---|
| level | the log level of the event |
| ts | timestamp of the event in unix epoch |
| msg | main message |
| error | (optional) error message if present |
| stacktrace | (optional) stacktrace if present |
Gateway Agent Logs🔗
The following examples are reformatted for readability.
An example error event:
{
  "level": "error",
  "ts": 1686125489.6039624,
  "caller": "app/result\_adapter.go:19",
  "msg": "receiving event",
  "agent\_id": "35d1f1d5-318a-458e-9432-97d892c6c296",
  "error": "Get \\"<http://orchestrator/computations\\>": dial tcp: lookup orchestrator on 10.96.0.10:53: server misbehaving",
  "stacktrace": "main.resultAdapter.func1\\n\\t/go/src/app/result\_adapter.go:19"
}
An example computation request event:
{
  "level": "info",
  "ts": 1710169487.2425287,
  "caller": "agent/computation\_pipeline.go:186",
  "msg": "computation request",
  "agent\_id": "c4e84dc3-3248-44b2-890b-b4b6f0b472d0",
  "request": {
    "id": "a1f76a60-300c-43cd-af9a-f7f3cfec9e69",
    "resources": {
      "cpu": 0.5,
      "memory": 500
    },
    "authentication": {
      "userSession": "..."
    },
    "execution": {
      "image": "quay.io/apheris/statistics:0.3.0",
      "dataSources": \[
        {
          "path": "s3://apheris-tutorials-data/whas/worcester/data.csv",
          "key": "whas1\_gateway-1\_org-1"
        }
      \],
      "Parameters": {
        "NvflareParameters": {
          "arguments": "-u -m nvflare.private.fed.app.client.client\_train -m /workspace -s fed\_client.json --set secure\_train=true uid=f44f2052-659a-43fd-84f8-8942627d222c org=org\_yJz0JV5nAkFTkyl9 config\_folder=config",
          "deploymentID": "88aaf187-3ca2-4460-9271-359b1a4ef57d"
        }
      },
      "Statement": {
        "NvflareStatement": {
          "command": "/usr/local/bin/python3"
        }
      }
    },
    "replicas": 1
  }
}
An example heartbeat error event:
{
  "level": "error",
  "ts": 1687431881.4542866,
  "caller": "app/main.go:179",
  "msg": "heartbeat",
  "agent\_id": "972a5b9d-d67e-4474-a3fb-1240cbfedd67",
  "error": "error response from server: <html>\\r\\n<head><title>504 Gateway Time-out</title></head>\\r\\n<body>\\r\\n<center><h1>504 Gateway Time-out</h1></center>\\r\\n</body>\\r\\n</html>\\r\\n",
  "stacktrace": "main.main.func4\\n\\t/go/src/app/main.go:179\\ngithub.com/apheris/node-agent/pkg/orchestrator.Client.GatewayHeartbeat.func1\\n\\t/go/src/app/pkg/orchestrator/orchestrator.go:155"
}
Notable events🔗
| msg field | level | when | description |
|---|---|---|---|
| "configuration" | info | once at startup | agent configuration |
| "computation request" | info | for every computation request event | the entire payload of the computation request event |
| "heartbeat" | error | for every heartbeat error event | the error message and the stacktrace of the heartbeat error event |
Data Access Layer (DAL) Logs🔗
The following examples are reformatted for readability.
An example data access log event:
{
  "level": "info",
  "ts": 1709735744.1490877,
  "caller": "dal/http\_middleware.go:58",
  "msg": "request",
  "instance\_id": "64646a19-62f0-43c1-9c6a-30844a31f749",
  "http\_status": 200,
  "http\_method": "GET",
  "url": "/datasets/s3://apheris-tutorials-data/whas/worcester/data.csv",
  "request\_duration": 0.327430324,
  "error": ""
}
Notable events🔗
| msg field | level | when | description |
|---|---|---|---|
| "configuration" | info | once at startup | agent configuration |
| "request" | info | for every request for a dataset that DAL (Data Access Layer) serves | includes the dataset url (as url field) |